
NLP in Finance and Accounting (II): Text Similarity Measure
Published:
This is the second post of the series on NLP in finance and accounting. In this post, we will talk about the text similarity measures.
Text Similarity Measure
Text-similarity measures are built on word frequency count. They go one step further to compute the similarity scores between two documents. According to Cohen et al. (2020), there are 4 types of commonly-used similarity measures.
- Cosine similarity: it is computed as the cosine of the angle between the vector of two documents.
 where $D_{1}^{TF}$ and $D_{2}^{TF}$ are the term frequency vectors for document $D_{1}$ and $D_{2}$, $||\ ||$ is the Euclidean norm.
 - Jaccard similarity: it is computed as the size of the intersection divided by the size of the union of the two documents’ term sets. Unlike Cosine similarity, term frequency is not considered in Jaccard similarity.

- Minimum edit distance: it is computed as the smallest number of operations required to transform one document into the other.
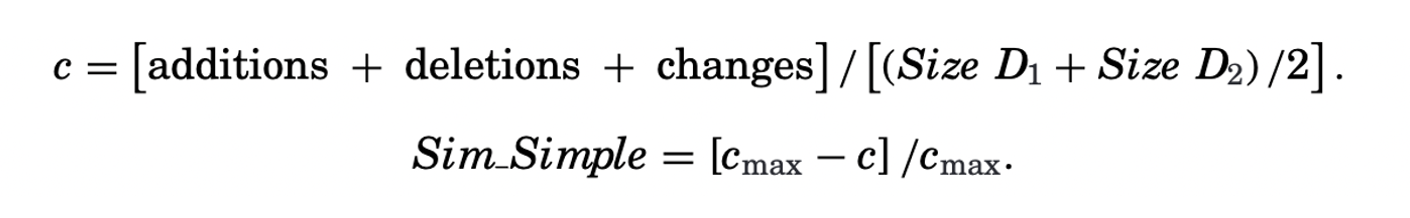
- Simple similarity: it is computed as the number of words in the changes, additions,and deletions between the two documents, scaled by their average size. It can be normalized to the range of $[0,1]$.
The Cosine and Jaccard similarity are more widely-used and easy-to-calculate compared to the other two. They ignore the word sequence and collapse a document into a vector of word counts.
Related Literature
Below are some examples of how text similarity measures are constructed in the field of finance and accounting. Same as before, I will focus on the measurement part and you are encouraged to check out other parts by yourself.
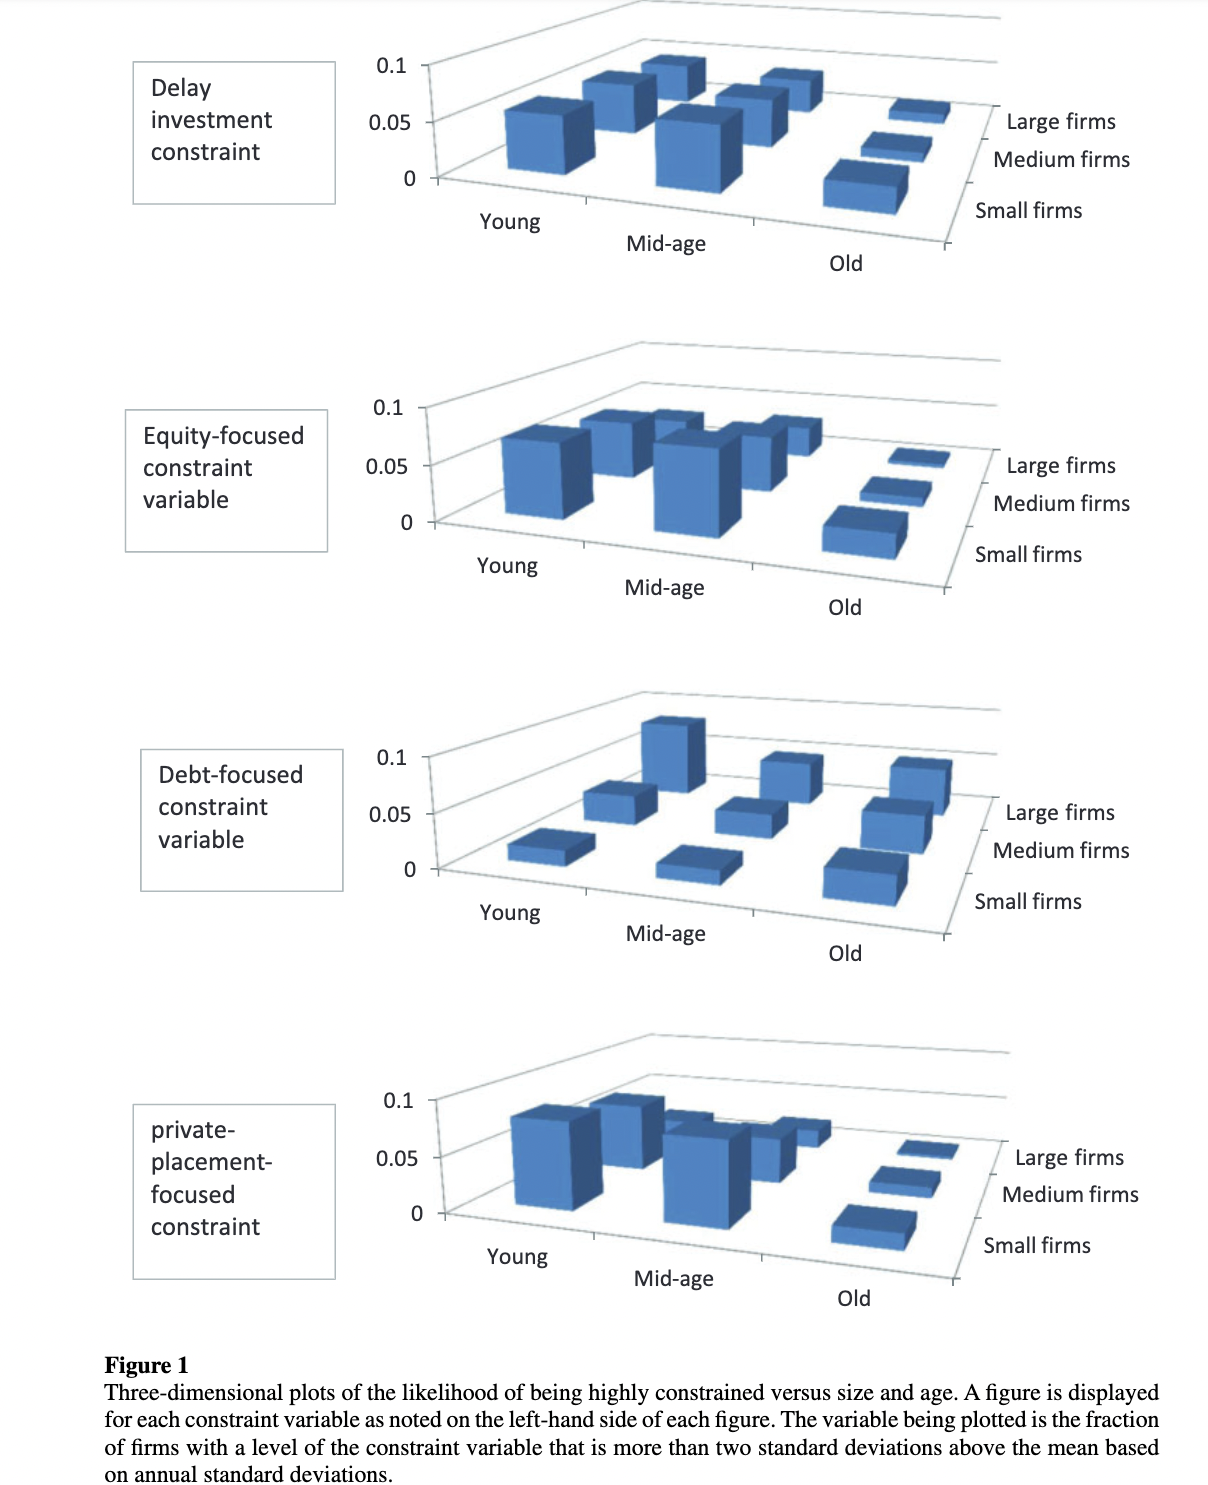
- Hoberg & Maksimovic (2015): it measures the financial constraints based on the text similarity of the Liquidity and Capitalization Resources (CAP+LIQ) subsection in the Management’s Discussion and Analysis (MD&A) section of 10-Ks. Four measures are constructed for each firm-year: those due to broad liquidity challenges leading to potential under-investment (Delay Investment Score), and those due to specific liquidity challenges pertaining to equity, debt, and private placement financing (Equity Focus Delay Investment Score, Debt Focus Delay Investment Score, Private Placement Focus Delay Investment Score). Specifically, they first identify the constrained firms, those curtail investment due to challenges to their liquidity, for each category. Then, they compute the Cosine similarity between a given firm-year and the average of firms in training set. Finally, constraint variables are defined to be orthogonal to two types of boilerplate content: (1) content that is in all CAP+LIQ in a given year (likely due to SEC filing requirements) and (2) content that is used by all firms in each industry in each year (likely due to common but uninformative industry statements). Detailed explanation can be found in Section 2 and Appendix B of the paper.
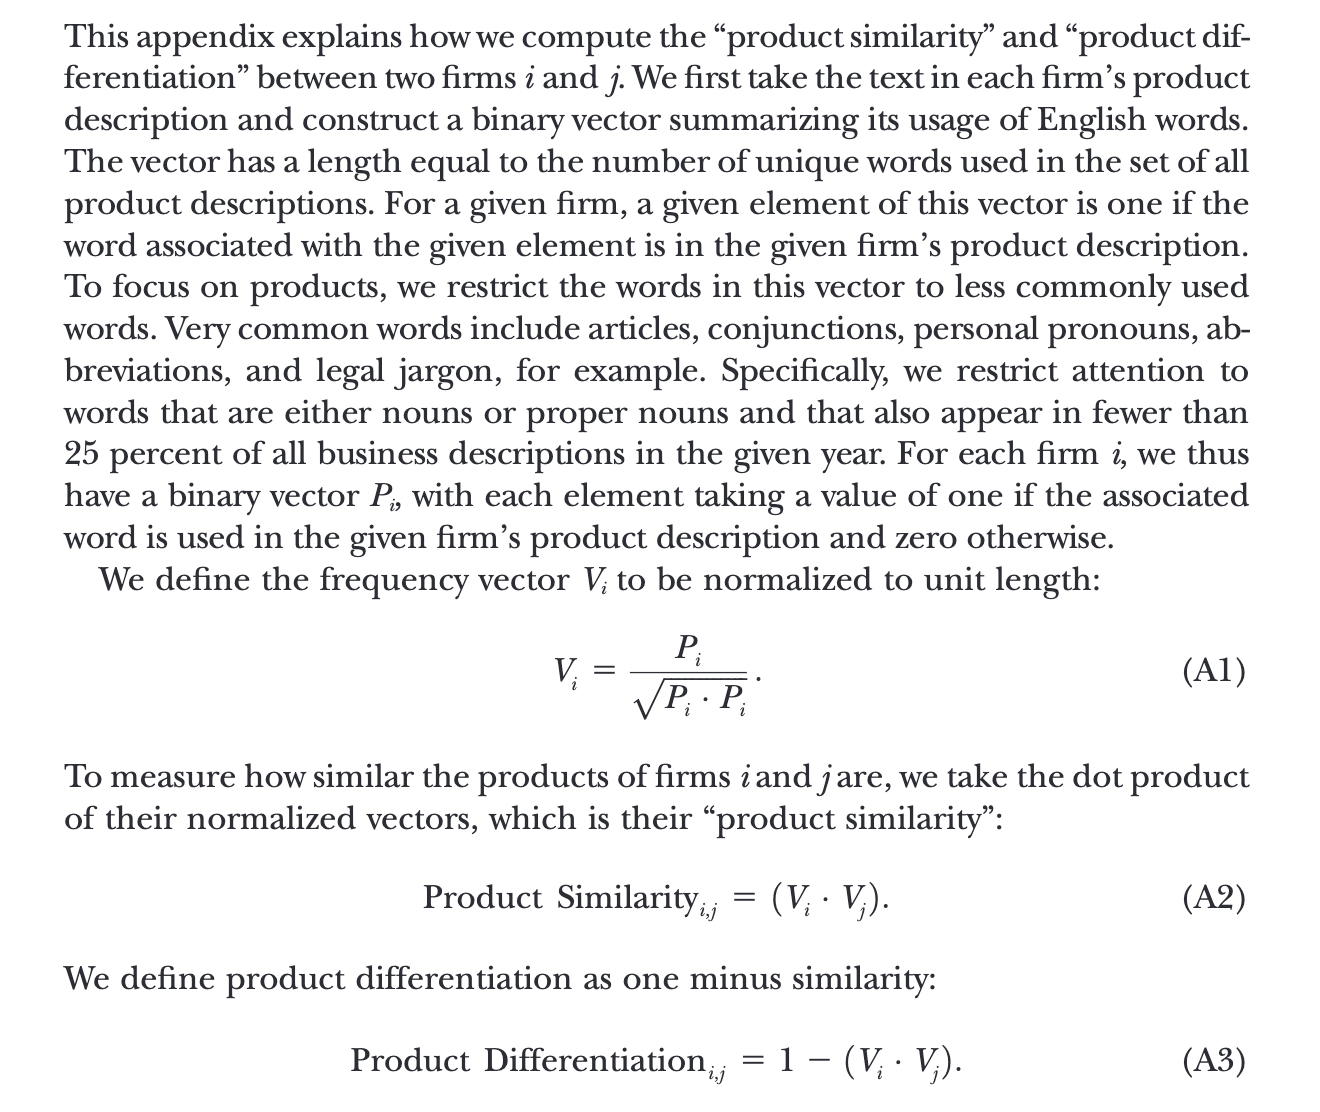
- Hoberg & Phillips (2016): it measures the product similarity for each pair of firms in a given year as the pairwise Cosine similarity of their business description sections in 10-Ks. According to this measure, they generate a new set of industries in which firms can have their own distinct set of competitors. Their TNIC HHI and total similarity data is available on their website. Below is a detailed description of how they construct the product similarity and differentiation measures.
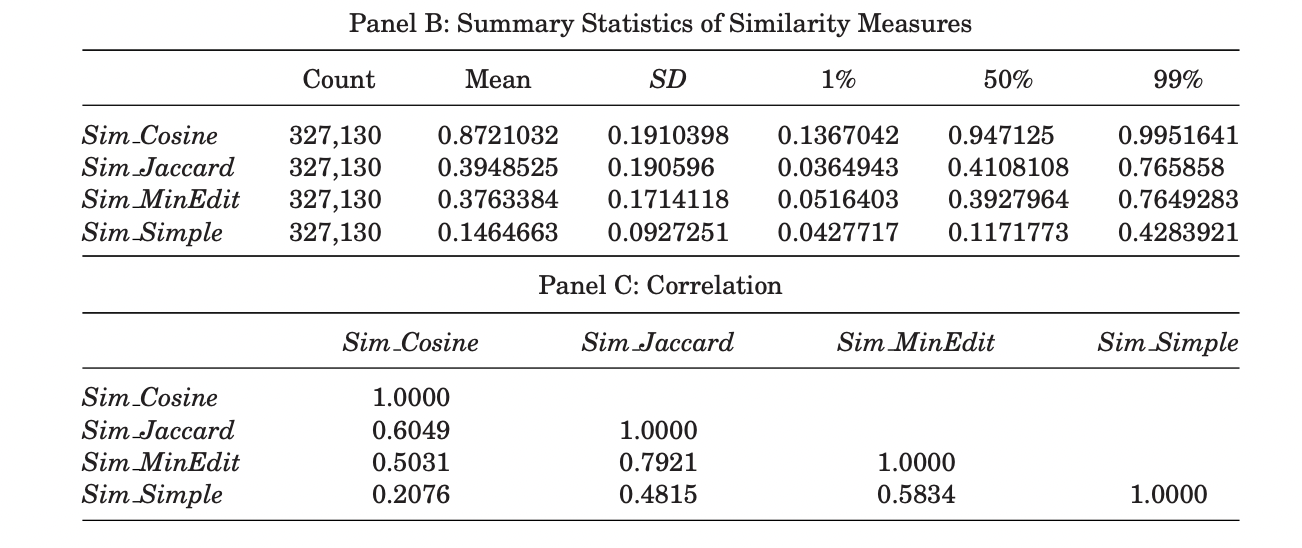
- Cohen et al. (2020): it measures the change of financial reports as the quarter-on-quarter similarity between 10-Q and 10-K filings using four similarity measures (Cosine similarity, Jaccard similarity, minimum edit distance, and simple similarity). From their summary statistics, we can find that the cosine similarities tend to be the highest when comparing documents with standardized format. They also construct other text-based measurements, including sentiment of change, uncertainty of change, litigiousness of change as the number of negative words, uncertainty words, litigiousness words normalized by the size of change respectively.
- Florackis et al. (2020): it measures the cybersecurity risk as the average similarity of each firm-year cybersecurity risk disclosure with past cybersecurity risk disclosures of firms that have been subject to a major cyberattack during the one-year period ending at the firm’s filing date (they refer this set of firms as the training sample). Both Cosine and Jaccard similarity are calculated. If no major cyberattack occurred in previous year, then previous two-year period is considered. The task is not as simple as it sounds, they have spent great effort to extract sentences related to cybersecurity risk from 10-K “Item 1A. Risk Factors” section and to collect the training sample from PRC database and Factiva.

- Biasi & Ma (2022): it measures the education-innovation gap of a given syllabus as the ratio of its average similarities with (a) older knowledge vintages, e.g., all articles published 13-15 years prior to the syllabus’s date and (b) frontier knowledge, e.g., all articles published 1-3 years prior. The word vector for each document (syllabus or article) are constructed using the“term-frequency-backward-inverse-document-frequency” (TFBIDF) approach, which gives more weight to unique terms than common terms. The main difference between TFBIDF with standard TFIDF is that only documents before the release of this document are considered when calculating IDF.

That’s all I have for this post. If you are also interested in applying NLP techniques to finance research, feel free to check out other pieces.
Stay tuned to this series, see you next time!
Reference
- Biasi, Barbara, and Song Ma, 2022, The Education-Innovation Gap. Working paper.
- Cohen, Lauren, Christopher Malloy, and Quoc Nguyen, 2020, Lazy Prices. The Journal of Finance 75, 1371–1415.
- Florackis, Chris, Christodoulos Louca, Roni Michaely, and Michael Weber, 2020, Cybersecurity Risk. Review of Financial Studies.
- Hoberg, Gerard, and Vojislav Maksimovic, 2015, Redefining Financial Constraints: A Text-Based Analysis. The Review of Financial Studies 28, 1312–1352.
- Hoberg, Gerard, and Gordon M. Phillips, 2016, Text-Based Network Industries and Endogenous Product Differentiation. Journal of Political Economy 124 (5), 1423–1465.